
Loading page
See which parts of the waveform drove each predicted token.
Saliency mapping attributes a prediction back to the waveform, so you can see which stretch of audio pushed the model toward the token or label it produced.
Saliency is an attribution method: it scores every moment of the input audio by how much it influenced the model's prediction. The result is a heatmap drawn over the waveform. High-scoring stretches are the parts the model leaned on most for a given token or label, so you can check that it is listening to speech rather than noise or silence.
The saliency operation supports three methods:
gradcam (Integrated Gradients)limeshapfull_audio flagBy default, saliency runs on a bounded window of the clip rather than the
full file. Set full_audio to run the attribution over the entire clip
instead of just the windowed portion — subject to the window limits below.
Saliency computation is memory- and compute-bound, so it's capped:
gradcam and lime: up to 12 seconds (MAX_SALIENCY_SECONDS).shap: up to 6 seconds (MAX_SALIENCY_SECONDS_SHAP) — SHAP is run with
a fixed number of samples per call (SALIENCY_SHAP_SAMPLES), which makes it
the most memory-sensitive of the three, hence the stricter window.If your clip is longer than the relevant limit, trim it or pick a shorter segment before requesting saliency.
A saliency map can look convincing and still be wrong. The companion check,
saliency_faithfulness, asks the honest question directly: if you delete the
parts of the waveform the map says matter most, does the prediction actually
change?
It does this with a deletion curve: progressively occlude the highest-attributed regions and re-run prediction, comparing the before/after result at each step.
The faithfulness result reports these metrics:
| Metric | What it measures |
|---|---|
aopc_deletion | Average drop in the model's score as the top-attributed regions are deleted, across the deletion curve. Bigger drop = the map found regions the model really relies on. |
aopc_random (+ stderr) | The same drop when regions are deleted at random, averaged over random_repeats. The baseline the map has to beat. |
faithfulness_gain | aopc_deletion minus aopc_random. Positive means the map beats chance. |
aopc_inverse | The drop when the least important regions are deleted. Should be small. |
comprehensiveness | Score lost when the top regions are removed. High = those regions were necessary. |
sufficiency | Score kept when only the top regions remain. High = those regions alone were enough. |
auc_deletion / auc_insertion | Area under the deletion and insertion curves. Lower is better for deletion, higher for insertion. |
occlusion_spearman | Rank correlation between attribution and the measured effect of occluding each region, with its p-value. |
The result also carries an overall verdict — a map with too little audio
or signal to test is marked uninformative and includes a skipped_reason
instead of a misleading score.
A map that's faithful should show a real drop in confidence as the top fraction is deleted — clearly separated from what random deletion does at the same rate. If deleting the "important" region barely moves the prediction, treat the saliency map for that clip with suspicion rather than as ground truth.
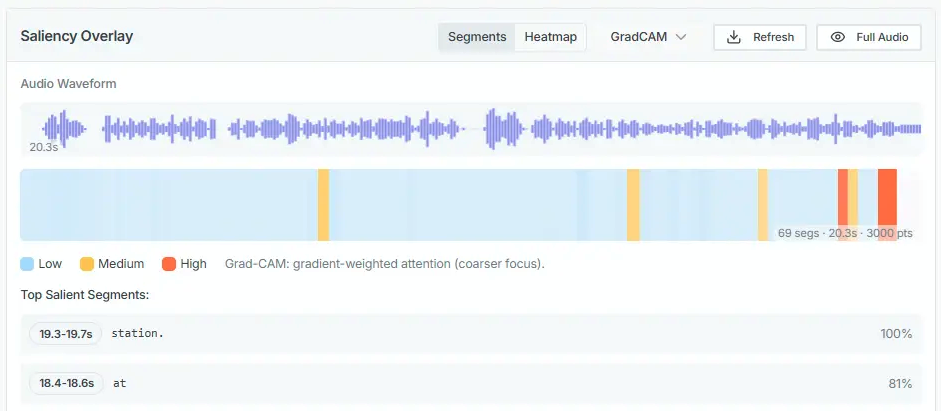
Saliency view
Saliency tells you where the model is looking. Perturbation tells you what happens if you actually change what's there — noise, pitch, time. Running both against the same clip is the fastest way to sanity-check an attribution: if saliency says a region matters, perturbing that region should move the prediction.